Projects
Uncertainties in the atmospheric chemistry of mercury
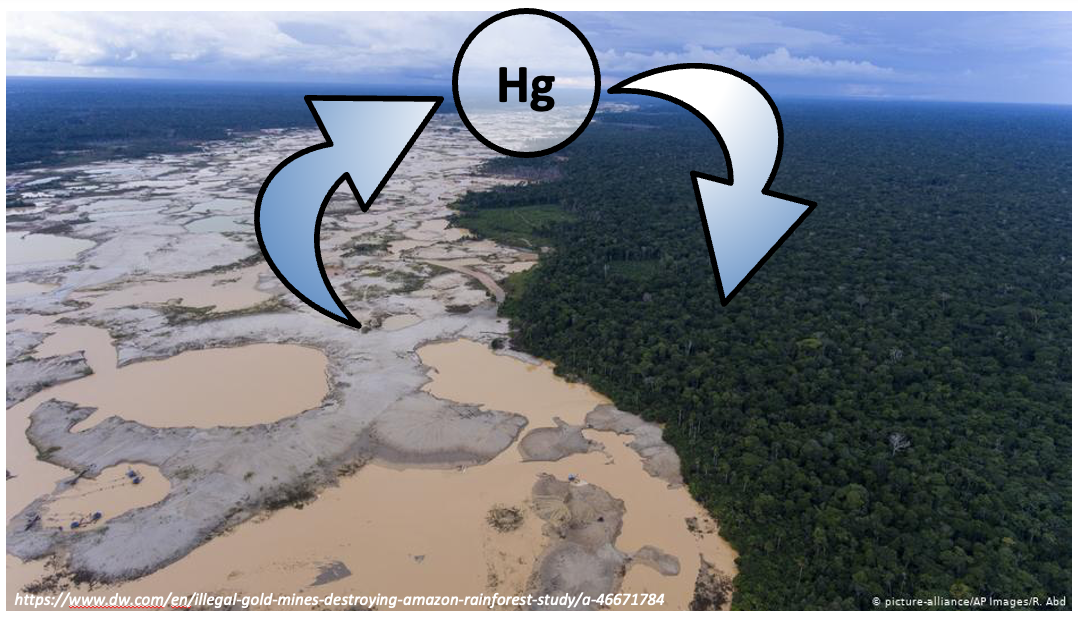
It is challenging to model the atmospheric redox transformations of mercury for a multitude of reasons: ambient field and laboratory measurements are scarce, concentrations of oxidized mercury are extremely low (pg m-3 level), and many reactants are involved. In my EU-funded MSCA project (TrendS and Uncertainties in Mercury (Hg) Atmospheric Chemistry), I aim to tackle these uncertainties using models and existing measurements. I will use tools from the field of global sensitivity analysis to identify key reactions and constrain their values based on field data, establishing a new chemical mechanism for atmospheric Hg models.

Drivers of recent mercury trends
Atmospheric mercury concentrations have been declining at most sites in North America, Europe, and East Asia over the last two decades. The drivers of these trends are highly uncertain, as anthropogenic mercury emissions inventories show global emissions increases over the same period. To assess the causes of recent mercury trends, I applied new statistical methods to Hg observation time series and models, showing that anthropogenic emissions of mercury have most likely declined over 2005–2020 (Feinberg et al., PNAS, 2024). Understanding the trends in Hg is crucial for the upcoming effectiveness evaluation of the Minamata Convention on Mercury.

Modelling vegetation uptake of atmospheric mercury
The terrestrial biosphere is a major sink of atmospheric mercury, but global estimates of this sink vary widely (1000 to 4000 tons per year). I compiled available measurements of mercury vegetation uptake from the literature and compared them to simulations in the global chemistry-transport model GEOS-Chem, in order to assess the magnitude of the mercury vegetation sink (Feinberg et al., 2022). I have also worked on how land use change through deforestation and reforestation impact the biosphere-atmosphere exchange of mercury (Feinberg et al., EST, 2024).

Biogeochemical selenium and sulfur cycles
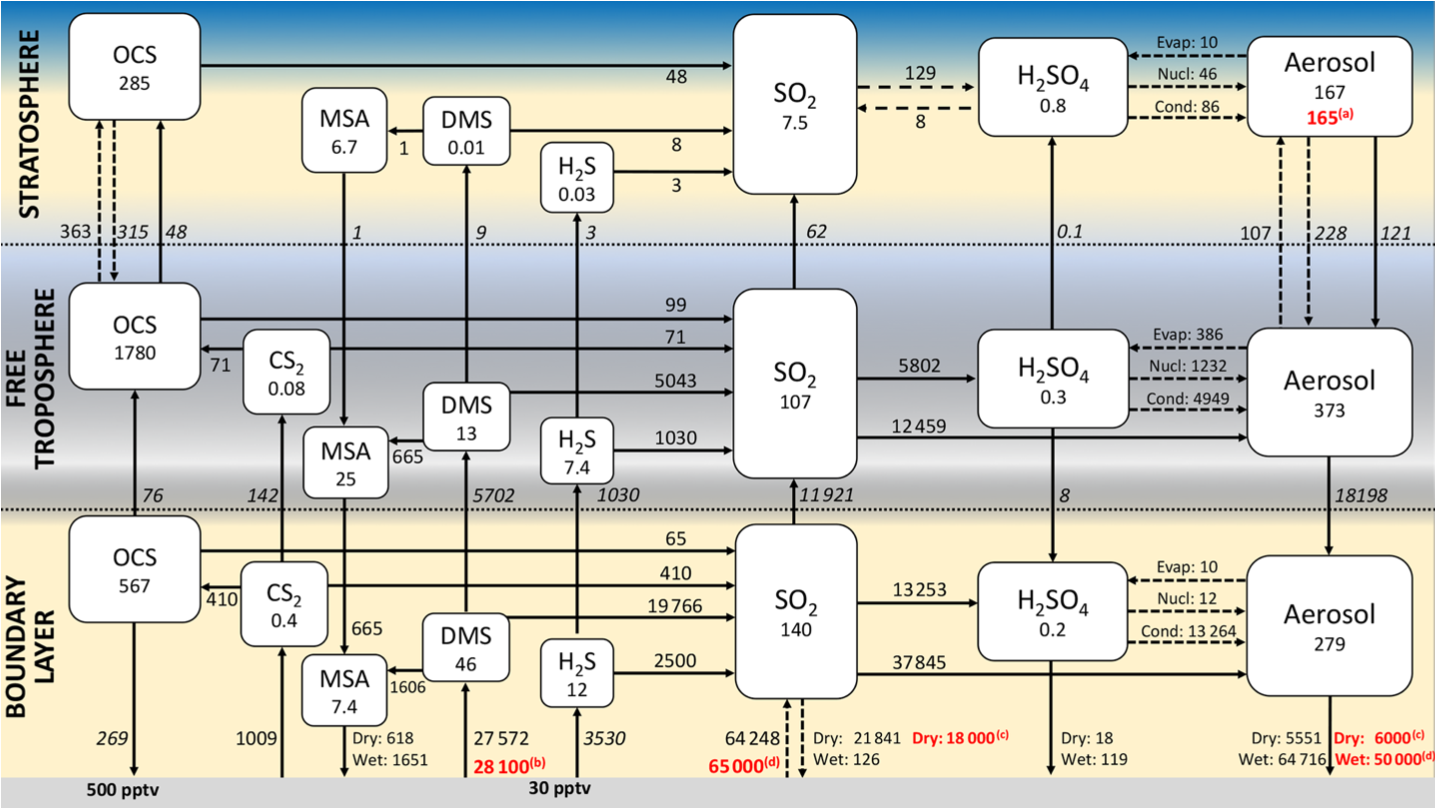
Selenium and sulfur are both essential nutrients for humans and animals, and sulfur is additionally required by plants. Atmospheric deposition of these elements to agricultural soils is important for replenishing nutrients lost during crop harvest. However, deposition of sulfur and selenium has been decreasing in Europe and North America over recent decades due to reduced anthropogenic emissions. I ran simulations in a chemistry-climate model (SOCOL-AER) studying recent and future trends in sulfur and selenium deposition under two socioeconomic scenarios (Feinberg et al., 2021). Across the Northern Hemisphere, deposition to agricultural soils will decline by 70–90% for sulfur and 55–80% for selenium by the end of the 21st century. These deposition changes will shift the mass balance of sulfur and selenium in the surface environment, as already evidenced by declining streamwater loads of selenium in the Northeastern US. We have also linked declining atmospheric deposition in the Baltic Sea region to recent decreases in the selenium concentration of herring tissues (Soerensen et al., 2022). Expanded monitoring and modelling of selenium and sulfur concentrations in the environment, food, and the human population is essential to assess the extent of nutritional risks.

Statistical techniques to assess and constrain model uncertainties
Atmospheric chemistry models contain many uncertain parameters, yet due to their computational complexity it has been difficult to explore their full uncertainty space. I conducted a global sensitivity analysis on the atmospheric selenium model (SOCOL-AER), considering the impact of 34 parameters (reaction rates, emissions, aerosol partitioning) on deposition maps and the overall atmospheric lifetime of selenium (Feinberg et al., ACP, 2020). The sensitivity analysis was facilitated by building a statistical emulator (surrogate model) in the form of polynomial chaos expansions to represent the output of the full SOCOL-AER model. Despite wide uncertainties in the atmospheric selenium reaction rate, I calculated that the mean atmospheric selenium lifetime is likely between 3 and 6 days, establishing that long range atmospheric transport (>1000 km) can occur. I also identified that uncertainties in selenium emissions are the main driver for uncertainties in deposition maps. This finding inspired our next study to constrain the emissions of selenium from different sources using Bayesian inference and a compiled database of atmospheric selenium observations from more than 600 measurement stations (Feinberg et al., EST, 2020). Our new observation-constrained estimate of global selenium emissions (29–36 Gg per year) is approximately double previous estimates in the literature. The SOCOL-AER model using optimized emission estimates shows very good agreement with both the training set of particulate selenium measurements (R2 = 0.66) and independent validation sets of particulate selenium (R2 = 0.59) and wet deposition (R2 = 0.57) measurements. By applying a sensitivity and uncertainty analysis framework, I could improve the accuracy of the first atmospheric selenium model, produce global estimates of selenium deposition including uncertainties, and establish priorities for future research in environmental selenium cycling.

Modelling tropospheric and stratospheric sulfate aerosols
My PhD work used the aerosol-chemistry-climate model SOCOL-AER, first developed by Sheng et al. (2015). I contributed substantial developments to the sulfur cycle in SOCOL-AER, such as implementing interactive deposition schemes and improving the sulfur mass conservation (Feinberg et al., 2019). The new model version (SOCOL-AERv2) showed improved agreement with ground-based sulfur deposition networks and satellite measurements of sulfate aerosol properties. With its more accurate representation of deposition and sulfate aerosols, SOCOL-AERv2 will serve as the basis for future scientific studies on chemistry-climate modelling (e.g., Karagodin-Doyennel et al., 2021) and geoengineering (e.g., Weisenstein et al., 2021).

Methane isotopic source signatures
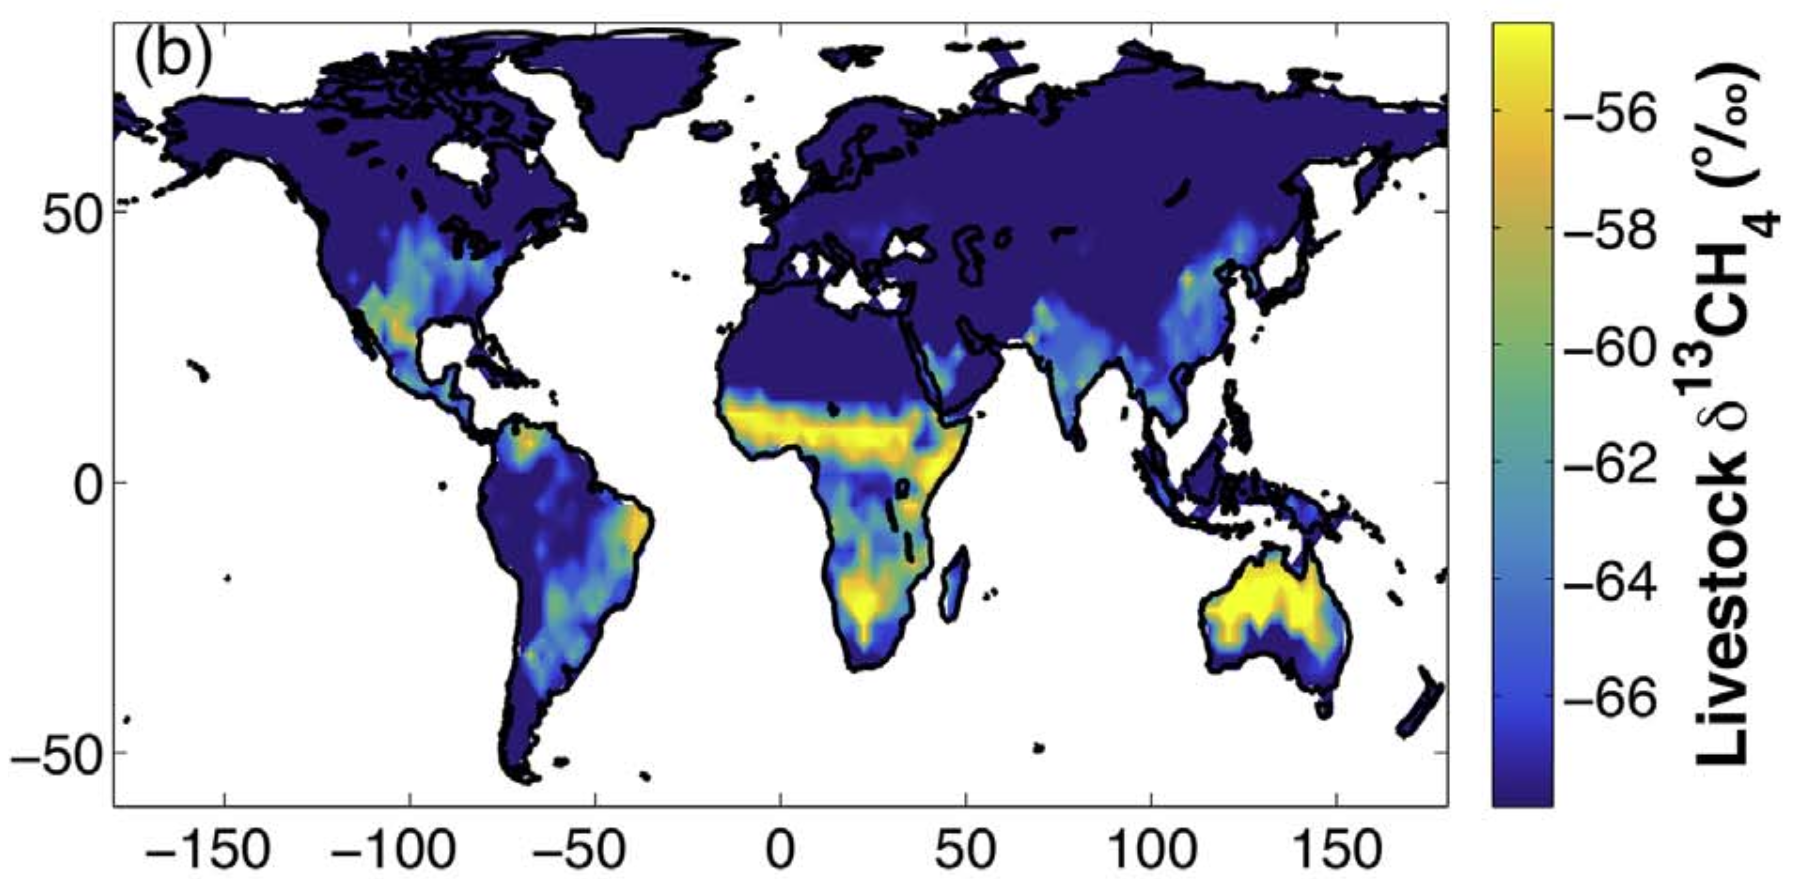
The isotopic ratio of the stable carbon isotopes (13C and 12C) in methane has been used in many studies to track the emission sources of methane. However, published isotopic source signatures are based on limited data and may not be accurate. Furthermore, past modelling studies have mostly used global mean isotopic signatures, with little consideration of regional variability in the signatures. In my MSc thesis, I produced regionally varying maps of isotopic source signatures for use in global atmospheric model simulations (Feinberg et al., 2018). Applying these source signature maps in a chemistry-climate model simulation (SOCOLv3) improved the agreement between the modelled and observed interhemispheric difference in the methane isotopic ratio. These mapped source signatures have been used as input data for subsequent methane modelling studies (e.g., Zhang et al., 2021).

